Predicting When ASX Companies Will Raise Capital
Lately I’ve been working on creating a predictive model for when a company will do a capital raise on the Australian Securities Exchange using structured data I’ve extracted from quarterly cash flow reports and other filings. The primary source for this has been the 4c.
The Problem
If you’ve ever invested in ASX small caps, you know the drill. A company you’re watching drops a “trading halt pending capital raise announcement” and you scramble to figure out: should I have seen this coming?
The reality is that most capital raises on the ASX are not surprises. Companies file quarterly cash flow reports (Appendix 4Cs) that disclose exactly how much runway they have. The information is there. It’s just scattered across thousands of PDFs, and by the time you’ve read one, three more have been lodged.
I wanted to know: can you systematically predict which companies will raise capital, and roughly when?
Why It Matters
For brokers and corporate advisors, knowing who’s likely to need capital in the next 6-12 months is I believe an important part of deal origination. The firms I’ve spoken with (boutique advisory shops, mid-tier brokers) all use some variant of “screen by cash, call the ones that look low.” While this is one method, having this model would enable a simple scan of the market and produce a list of tickers.
For the distinguished punter, anticipating dilution events before they hit is alpha. A placement announcement typically moves the stock, and not always in the direction existing shareholders want.
For companies themselves, understanding where they sit relative to peers can inform the timing and structure of their next raise.
The Dataset
I’ve spent the past 18 months building a structured database of ASX filings. The core of this experiment uses:
- 7,224 quarterly 4C snapshots across hundreds of companies
- Complete cash flow line items: operating burn, financing, investing, receipts
- Lagged values from prior quarters
- Capital raise history: placements, SPPs, rights issues going back years
- Board composition and changes
- M&A activity, substantial holder movements, insider trading
- Announcement pace and frequency and sentiment signals
The target variable is simple: did the company raise capital within 180 days? Within 365 days?
Dataset Overview
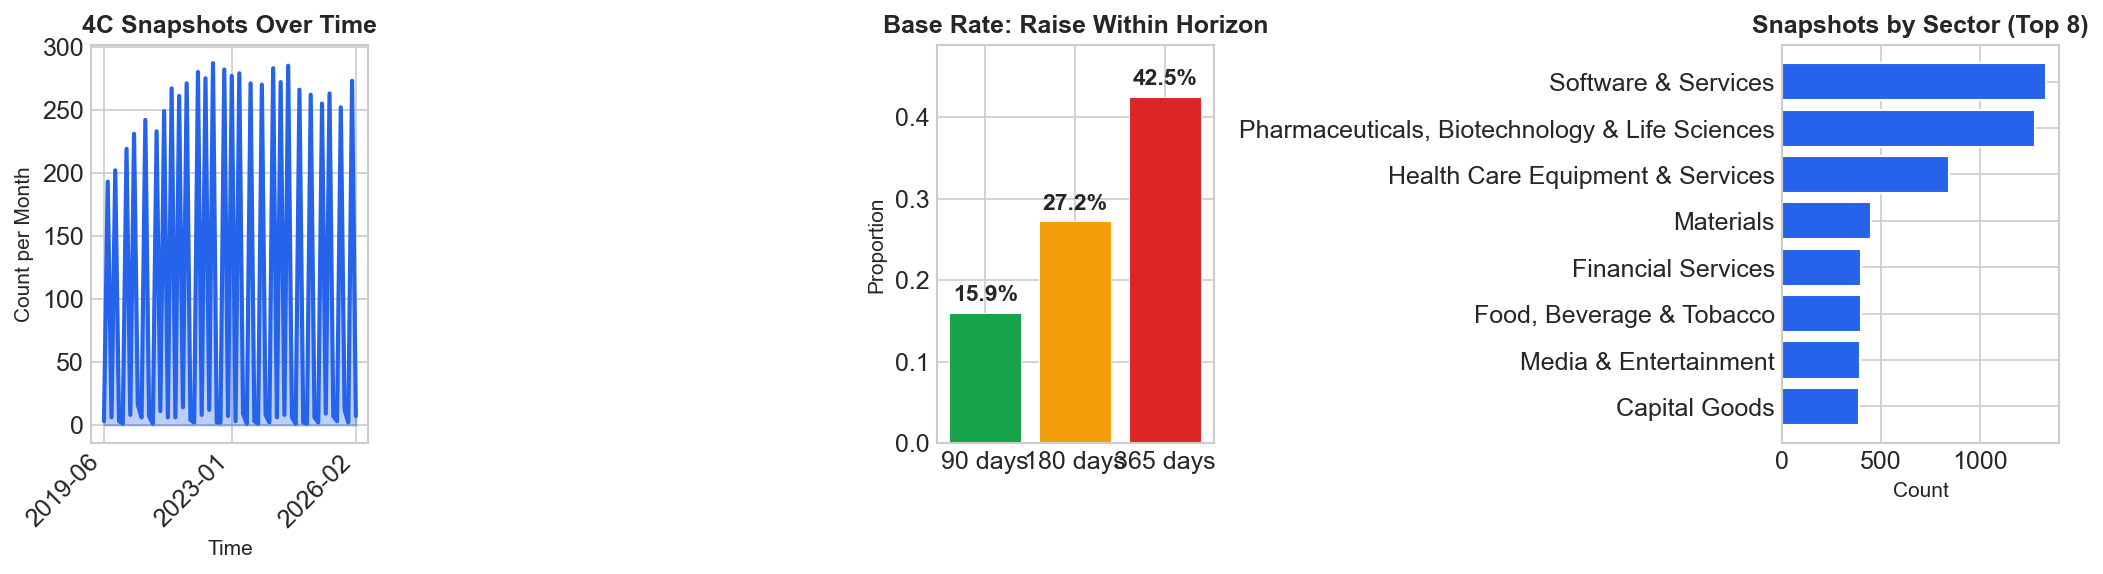
Roughly 29% of 4C snapshots are followed by a raise within 180 days. About 46% see a raise within a year.
The Modeling Approach
I tried several approaches:
- Direct binary classification (will they raise in 180d? 365d?)
- Timing bucket classification (0-90d, 91-180d, 181-365d, >365d)
- Direct regression (predict exact days to next raise)
- Discrete-time hazard model (probability of raise in each future quarter, conditional on not having raised yet)
The direct regression was weakest. Predicting exact days to next raise gave negative R². This is unsurprising: capital raises are driven by discrete decisions, not continuous decay.
The hazard model performed best. As a survival problem, where each quarter is a period at risk of the “event” (a capital raise), the model learns both the probability of raising and the likely timing window.
Discrete-Time Hazard Model
Instead of predicting one binary label, the model learns four conditional hazard rates:
- P(raise in Q1)
-
P(raise in Q2 survived Q1) -
P(raise in Q3 survived Q1 and Q2) -
P(raise in Q4 survived Q1, Q2, and Q3)
Multiplying these out gives cumulative raise probabilities for any horizon, plus a natural quarter-by-quarter risk curve.
The Results
The current model (HistGradientBoostingClassifier on the hazard-transformed data) achieves:
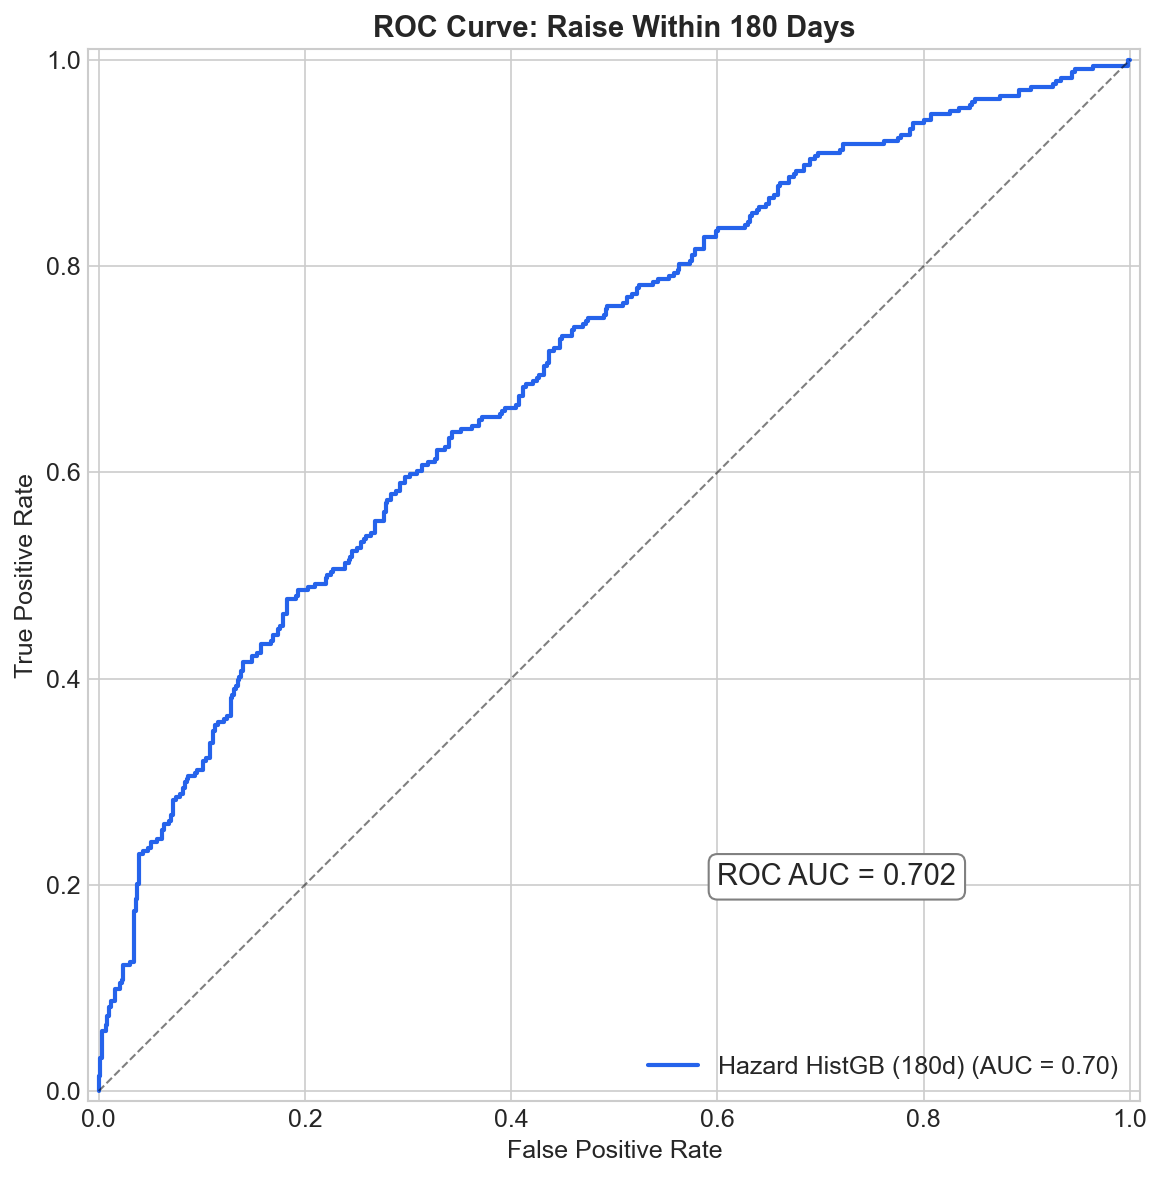
Raise within 180 days:
- ROC AUC: 0.70
- PR AUC: 0.59
- Precision: 67% at recall of 31%
- Top decile lift: ~1.7x
Raise within 365 days:
- ROC AUC: 0.72
- PR AUC: 0.87
- Precision: 85% at recall of 62%
What this means: The model is much better at predicting if a company will raise capital within a year rather than when they will do it.
The 85% precision number shows that the model strongly flags a company as needing a raise within the next year, correctly 85% of the time. So in perhaps simpler terms the model works great as a “red flag” system. We can’t predict the exact day a trading halt will drop, but we can identify the “danger zone” companies statistically likely to dilute shareholders soon.
ROC Curve 180 Days
Lift Chart 180 Days
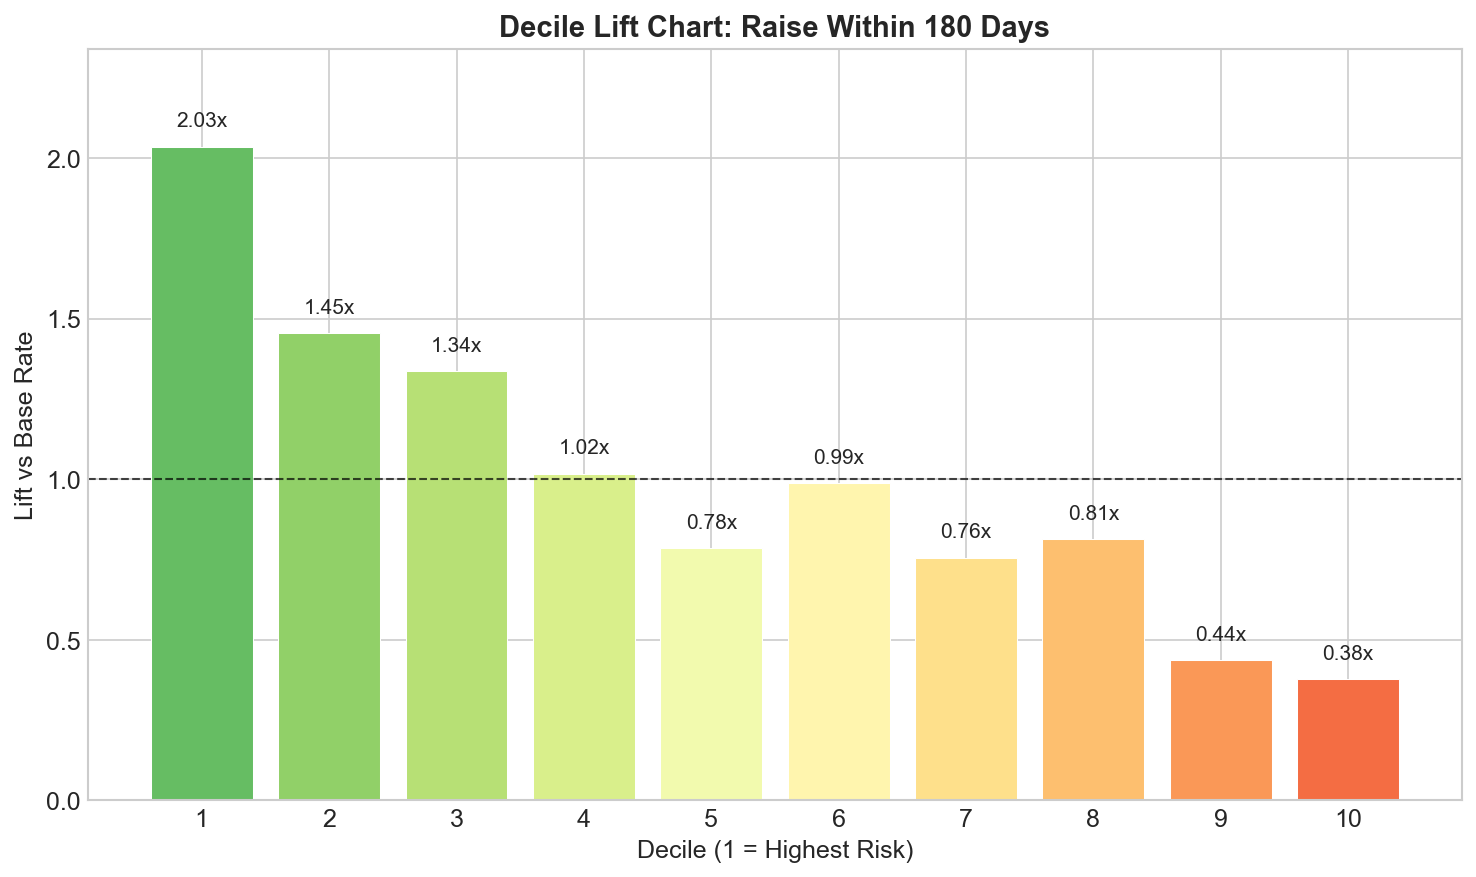
The lift chart is perhaps most relevant for practical use. If you rank companies by predicted raise probability and look at the top decile, you see roughly 1.7x the base rate of raises.
What the Model Learns The feature importance analysis confirms the model is picking up sensible drivers:
Feature Importance
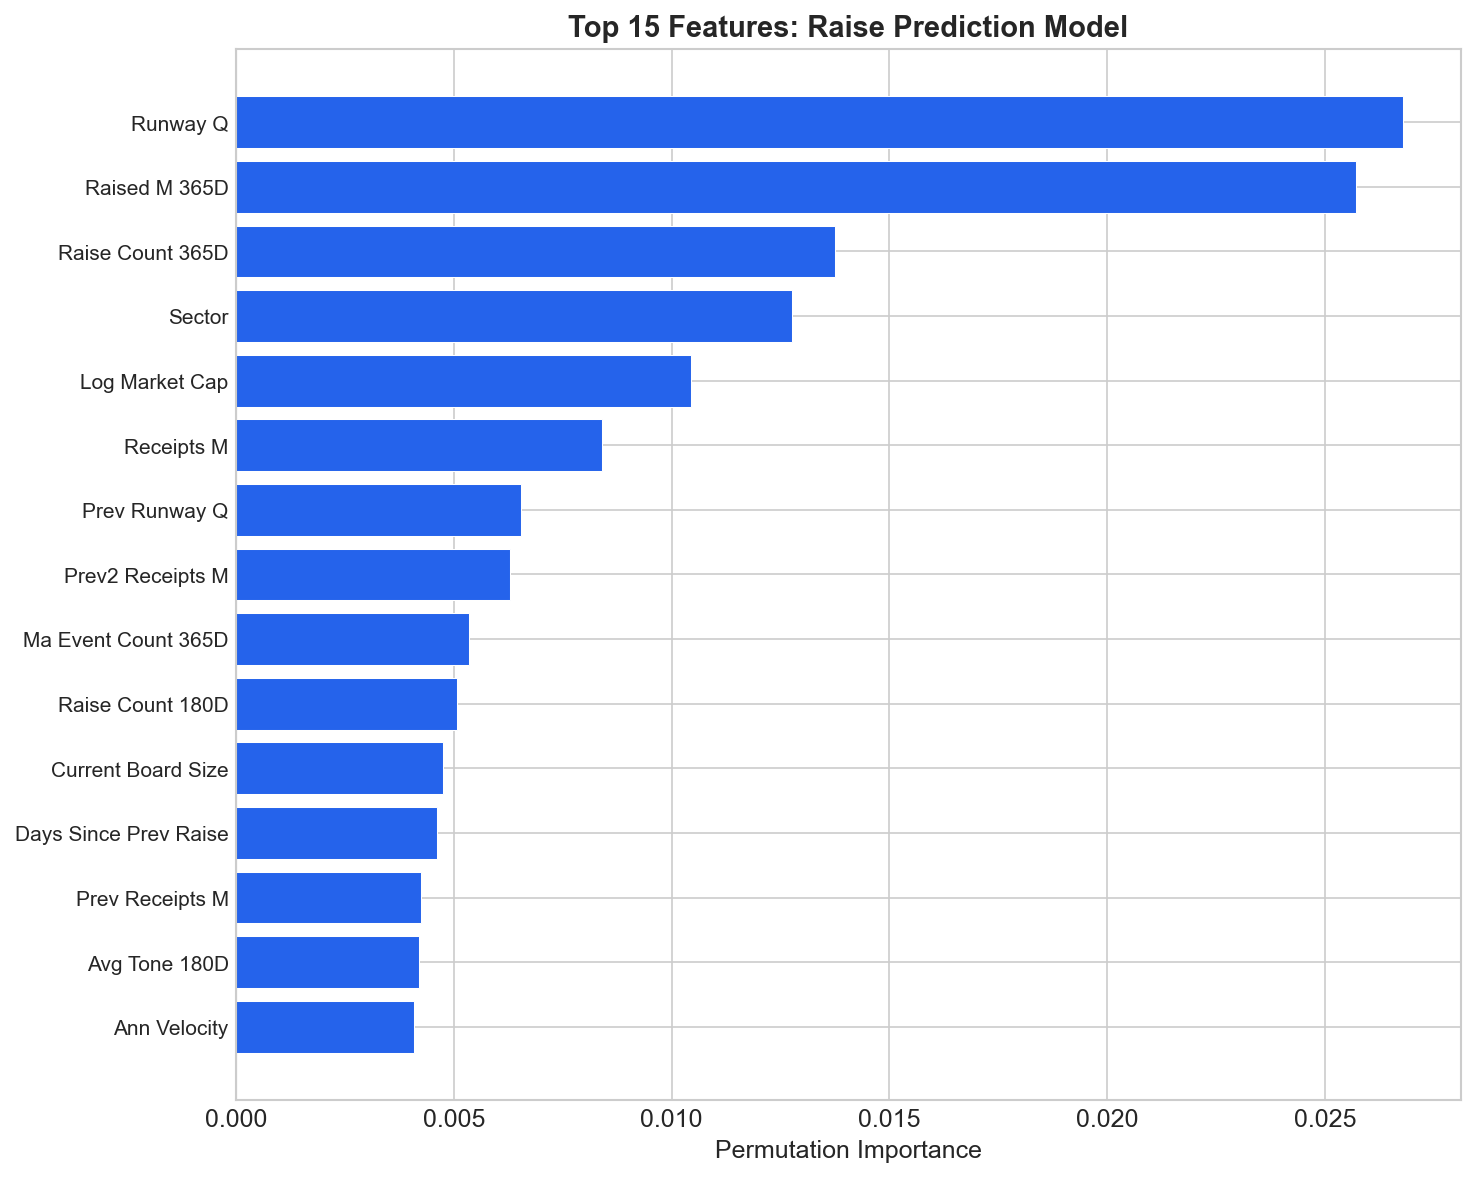
Top predictors:
runway_q: Cash runway in quarters. The single strongest signal.raised_m_365d: Amount raised in the past year. Past raisers raise again.raise_count_365d: Frequency of recent raises.sector: Materials and Energy behave differently than Healthcare.log_market_cap: Smaller companies raise more frequently.prev_runway_q: Trajectory matters. Deteriorating runway is predictive.receipts_m: Companies with real revenue behave differently.ma_event_count_365d: M&A activity signals capital needs.
This isn’t surprising if you’ve spent time with small caps. But having the data to prove it, and to quantify the effect sizes, is valuable.
Quarter Over Quarter Deterioration
An entirely unsurprising finding was that quarter over quarter changes in the 4C numbers add significant signal, especially for the shorter-horizon (180d) prediction.
A company whose cash dropped 25%+ in the last quarter, with an increased burn rate, and whose runway just fell below 2 quarters is materially more likely to raise soon than a company with the same static snapshot but stable trajectory.
So if you’re burning cash like its going out of fashion you’ll probably need to tap the market soon.
I added a composite “deterioration score” that flags these situations, and it consistently ranks in the top features.
Runway Scatter
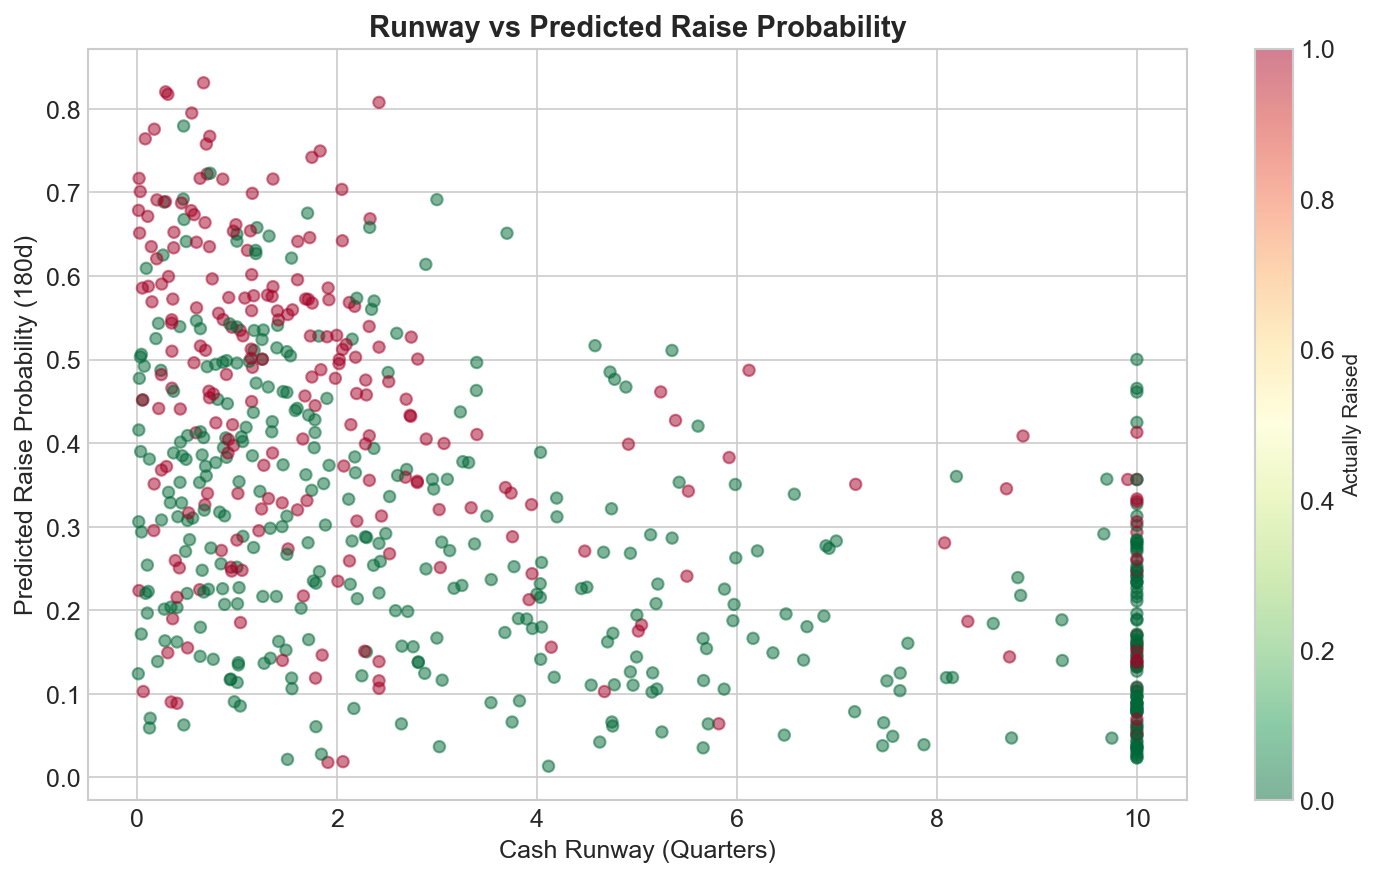
This scatter plot shows the relationship between cash runway and predicted raise probability. Low runway (left side) concentrates high probabilities (top), but there’s significant variation. That variation is explained by the other features: recent raise history, sector, trajectory, and so on.
What Doesn’t Work Well
Exact timing prediction is very hard. The bucketed timing classifier achieves only ~37% accuracy across four buckets. Top-2 accuracy is around 61%, meaning the model often gets close but not exact.
This is probably irreducible but its always worth a try. Capital raising is a discrete decision made by humans in response to market conditions, share price movements, and strategic opportunities. The model can identify who is likely to raise, but pinning down exactly which quarter will always have high variance.
Calibration
An important check is whether the predicted probabilities are well calibrated. A model that says “40% chance of raising” should be right about 40% of the time.
Calibration Curve 180 Days
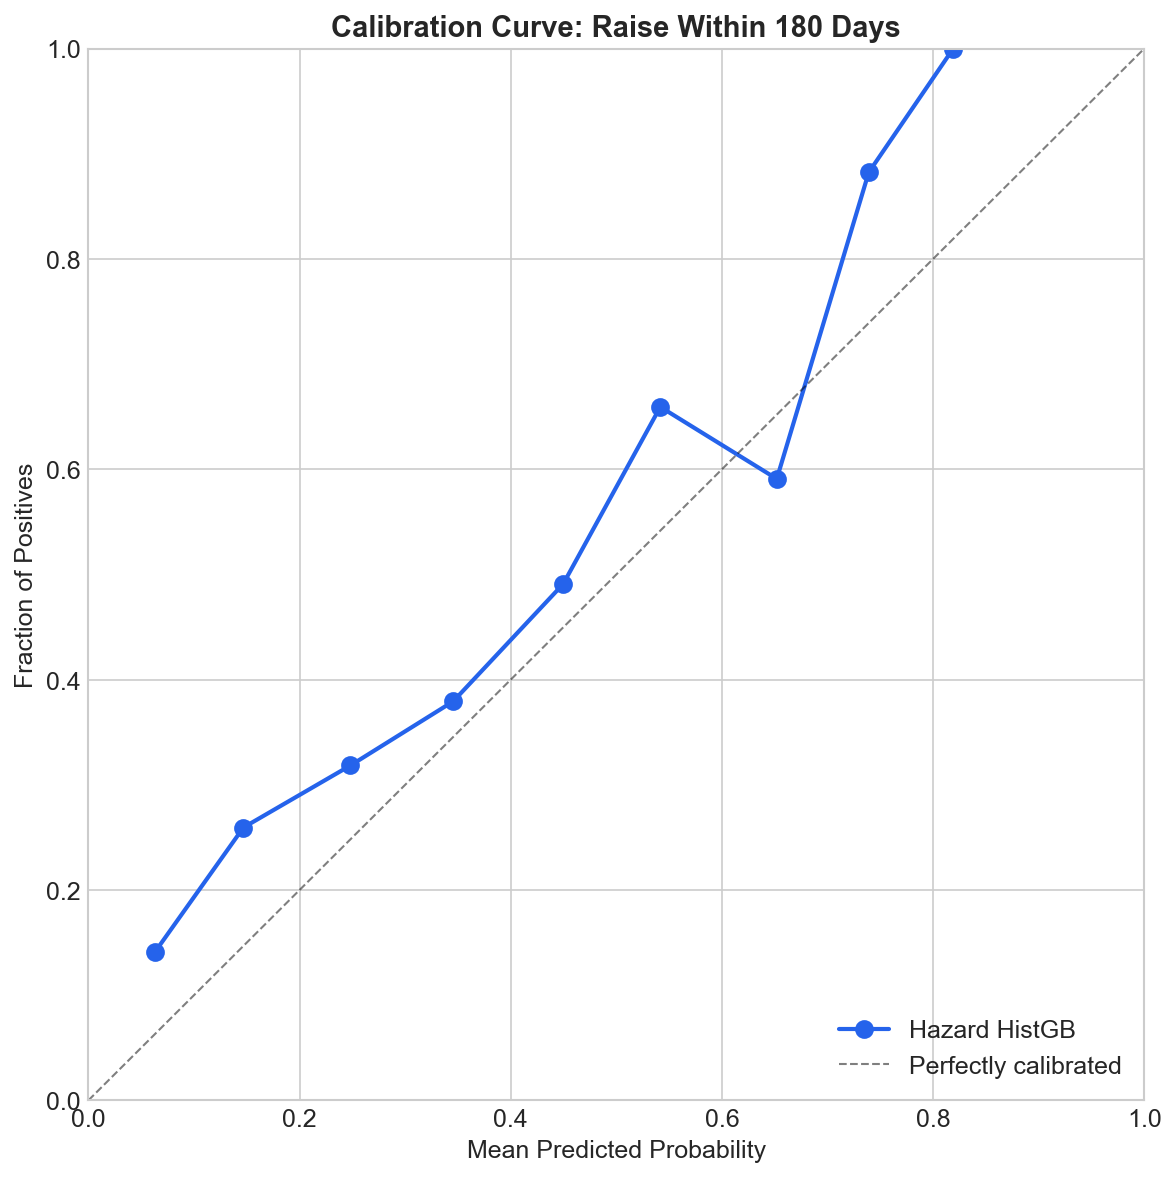
The calibration curve shows reasonable alignment, though there’s some overconfidence at the low end and underconfidence at the high end. While typical for gradient boosting models this could be addressed with isotonic calibration in production.
Where This Goes
The most natural product direction is a raise-need ranking model:
- Rank 4C companies by cumulative probability of raising in the next 2 quarters
- Attach a quarter by quarter hazard curve for timing context
- Update weekly as new 4Cs are lodged
That said the next step will be adding in the 5c which are seem to be largely structured the same.
As it stands the model in its current state seems use for deal origination and could replaces manual screening or for investors doing risk management to flag upcoming dilution events.
If you’re interesting in having a conversation about the model and how it could be of use to your reach out to me and we can chat.
Technical Notes
- Feature engineering is done in Python (pandas, numpy)
- Models are scikit-learn (HistGradientBoostingClassifier)
- Time-based train/test split: train on data up to Oct 2024, test on data since
The discrete-time hazard transformation involves expanding each snapshot into 4 person-period rows (one per future quarter), with a binary event indicator for whether the raise occurred in that specific quarter. This seemed to be the right standard survival analysis technique adapted for quarterly data (open to queries of why? or accusations that is in fact wrong).
If you’re working on similar problems, feel free to reach out. I’m particularly interested in:
- Connections to larger broker/dealer shops who do rights issues and SPPs at scale
- Buy-side firms interested in systematic dilution risk signals
- Anyone building data products in the ASX space
You can find me on Twitter or LinkedIn.
This is not financial advice. Past model performance does not guarantee future results. The code and methodology are my own work.